Observability Dev Services with Grafana OTel LGTM
This Dev Service provides the Grafana OTel-LGTM, an all-in-one Docker image containing an OpenTelemetry Collector receiving and then forwarding telemetry data to Prometheus (metrics), Tempo (traces) and Loki (logs).
This data can then be visualized by Grafana. The LGTM abbreviation stands for:
Configurar el proyecto
If you are using quarkus-opentelemetry or quarkus-micrometer-opentelemetry this Observability extension is already bundled and the container will start automatically in dev mode.
If the mentioned extensions are not present, you can manually add the Quarkus Grafana OTel LGTM sink (where data goes) extension to your build file:
<dependency>
    <groupId>io.quarkus</groupId>
    <artifactId>quarkus-observability-devservices-lgtm</artifactId>
    <scope>provided</scope>
</dependency>implementation("io.quarkus:quarkus-observability-devservices-lgtm")Micrometer
The Micrometer Quarkus extension provides metrics from automatic instrumentation implemented in Quarkus and its extensions.
There are multiple ways to output Micrometer metrics. Next there are some examples:
Using the Micrometer Prometheus registry
This is the most common way to output metrics from Micrometer and the default way in Quarkus. The Micrometer Prometheus registry will publish data in the /q/metrics endpoint and a scraper inside the Grafana LGTM Dev Service will grab it (pull data from the service).
<dependency>
    <groupId>io.quarkus</groupId>
    <artifactId>quarkus-micrometer-registry-prometheus</artifactId>
</dependency>implementation("io.quarkus:quarkus-micrometer-registry-prometheus")Using the Micrometer OTLP registry
The Quarkiverse Micrometer OTLP registry will output data using the OpenTelemetry OTLP protocol to the Grafana LGTM Dev Service. This will push data out of the service:
<dependency>
    <groupId>io.quarkiverse.micrometer.registry</groupId>
    <artifactId>quarkus-micrometer-registry-otlp</artifactId>
</dependency>implementation("io.quarkiverse.micrometer.registry:quarkus-micrometer-registry-otlp")When using the Micrometer’s Quarkiverse OTLP registry to push metrics to Grafana OTel LGTM, the quarkus.micrometer.export.otlp.url property is automatically set to OTel collector endpoint as seen from the outside of the Docker container.
OpenTelemetry
With OpenTelemetry, metrics, traces and logs can be created and sent to the Grafana LGTM Dev Service.
By default, the OpenTelemetry extension will produce traces. Metrics and logs must be enabled separately.
The quarkus-opentelemetry extension can be added to your build file like this:
<dependency>
    <groupId>io.quarkus</groupId>
    <artifactId>quarkus-opentelemetry</artifactId>
</dependency>implementation("io.quarkus:quarkus-opentelemetry")The quarkus.otel.exporter.otlp.endpoint property is automatically set to the OTel collector endpoint as seen from the outside of the Docker container.
The quarkus.otel.exporter.otlp.protocol is set to http/protobuf.
Micrometer to OpenTelemetry bridge
This extension provides Micrometer metrics and OpenTelemetry metrics, traces and logs. All data is managed and sent out by the OpenTelemetry extension.
All signals are enabled by default.
The extension can be added to your build file like this:
<dependency>
    <groupId>io.quarkus</groupId>
    <artifactId>quarkus-micrometer-opentelemetry</artifactId>
</dependency>implementation("io.quarkus:quarkus-micrometer-opentelemetry")Grafana
Grafana UI access
Once you start your app in dev mode:
quarkus dev./mvnw quarkus:dev./gradlew --console=plain quarkusDevYou will see a log entry like this:
[io.qu.ob.de.ObservabilityDevServiceProcessor] (build-35) Dev Service Lgtm started, config: {grafana.endpoint=http://localhost:42797, prometheus.endpoint=http://localhost:39090, tempo-mcp.endpoint=http://localhost:43200, quarkus.otel.exporter.otlp.endpoint=http://localhost:34711, otel-collector.url=localhost:34711, quarkus.micrometer.export.otlp.url=http://localhost:34711/v1/metrics, quarkus.otel.exporter.otlp.protocol=http/protobuf}Remember that Grafana is accessible in an ephemeral port, so you need to check the logs to see which port is being used. In this example, the grafana endpoint is grafana.endpoint=http://localhost:42797.
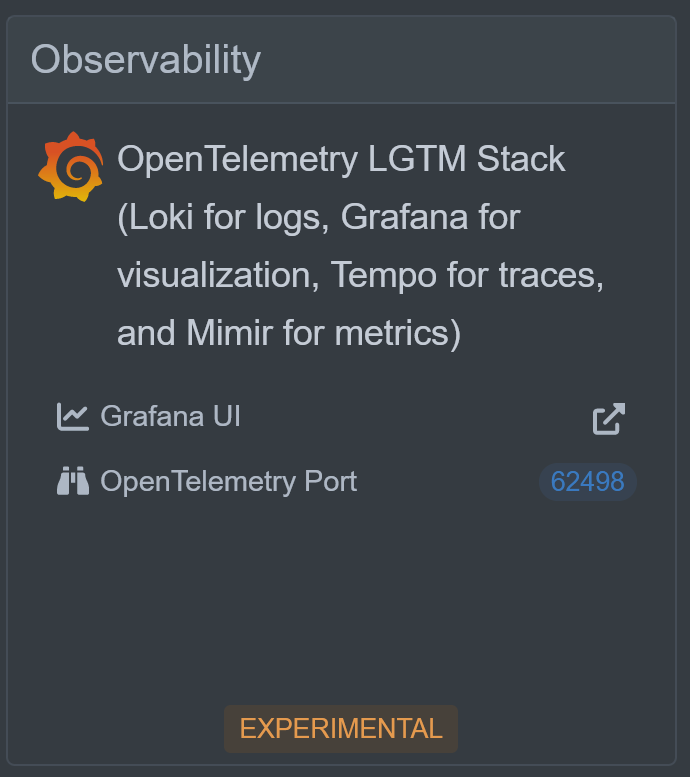
Another option is to use the Dev UI (http://localhost:8080/q/dev-ui/extensions) as the Grafana URL link will be available and if selected it will open a new browser tab directly to the running Grafana instance:
Explore
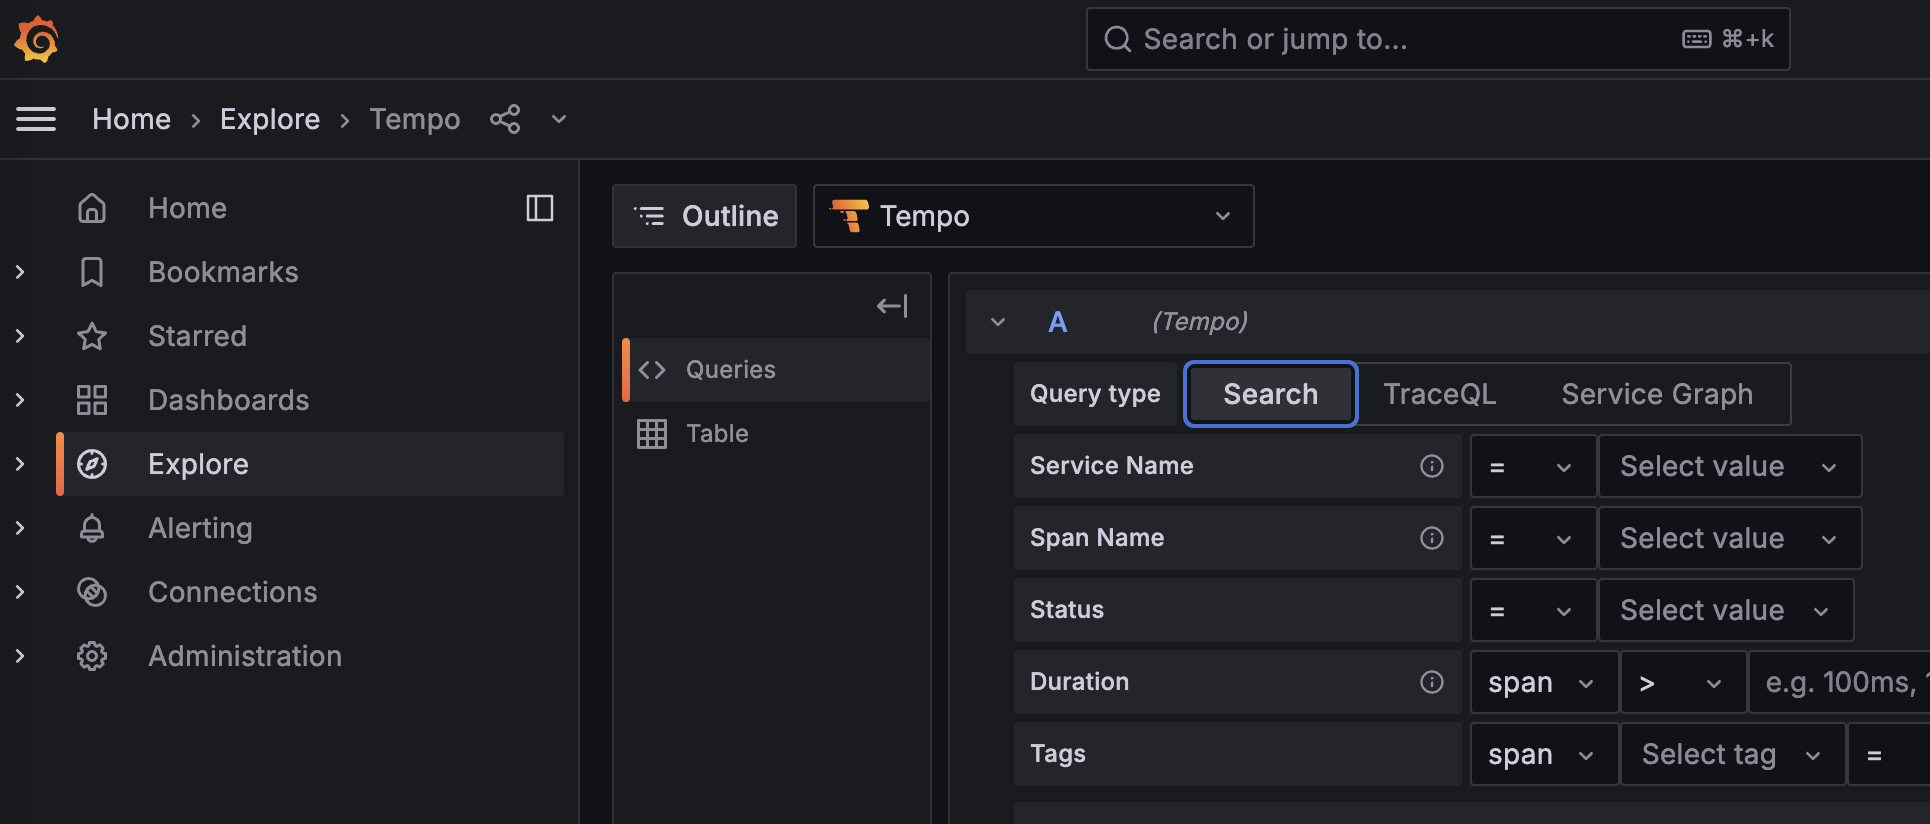
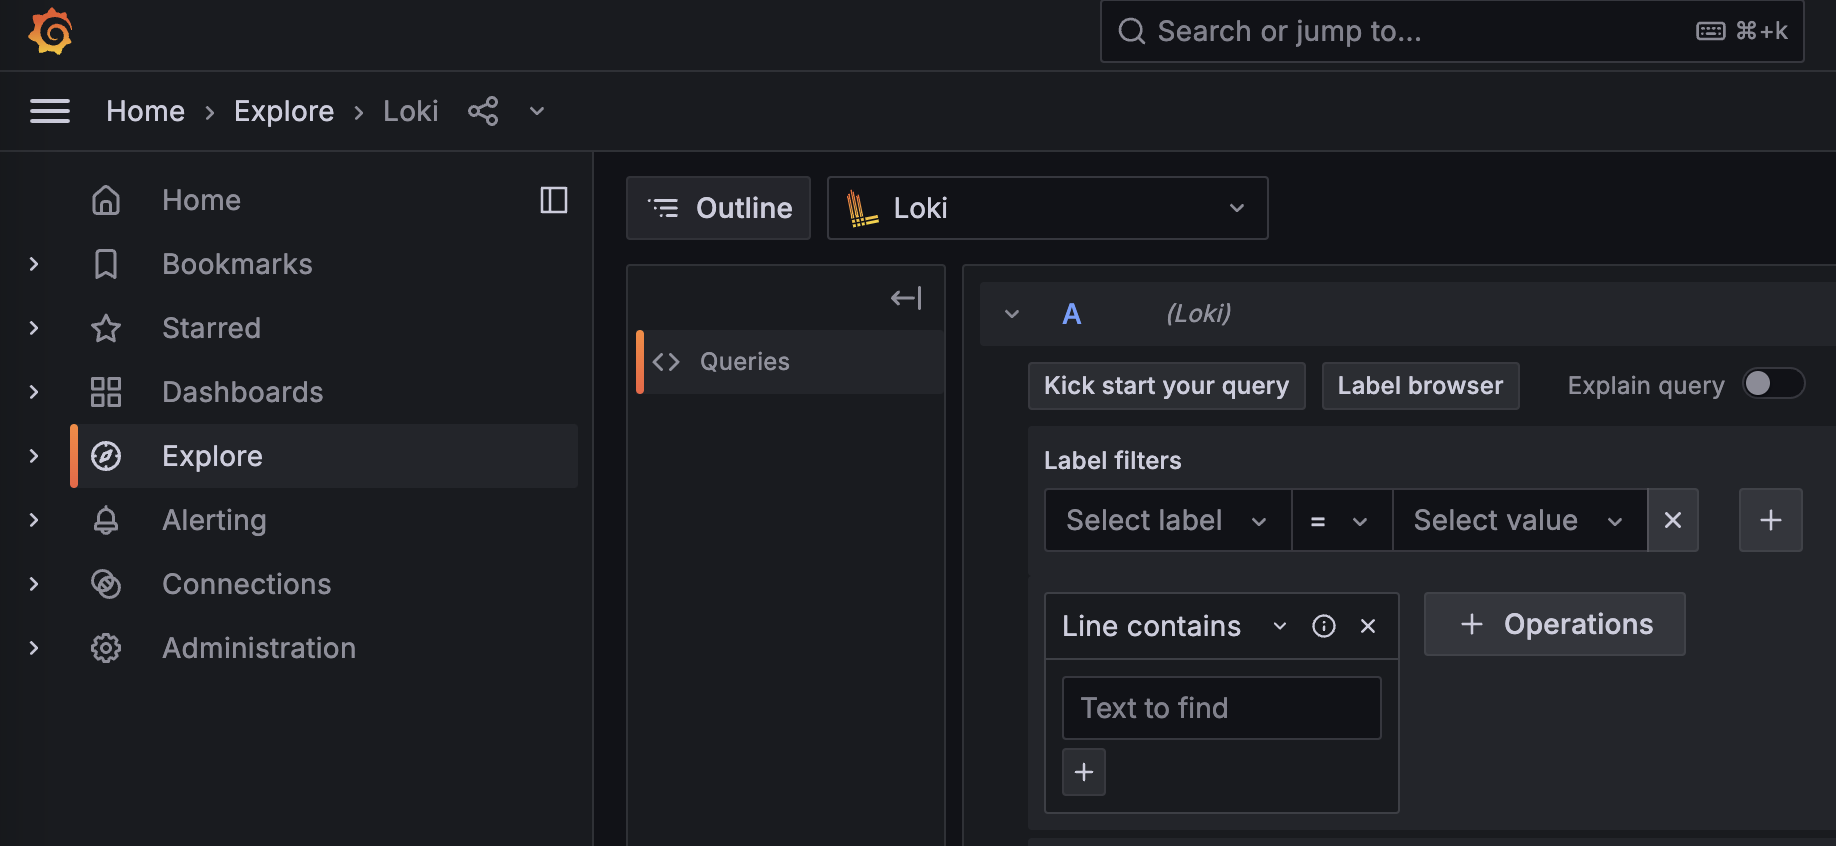
In the explore section, you can query the data for all the data sources.
To see traces, select the tempo data source and query for data:
For logs, select the loki data source and query for data:
The dashboards
The Dev Service includes a set of dashboards.
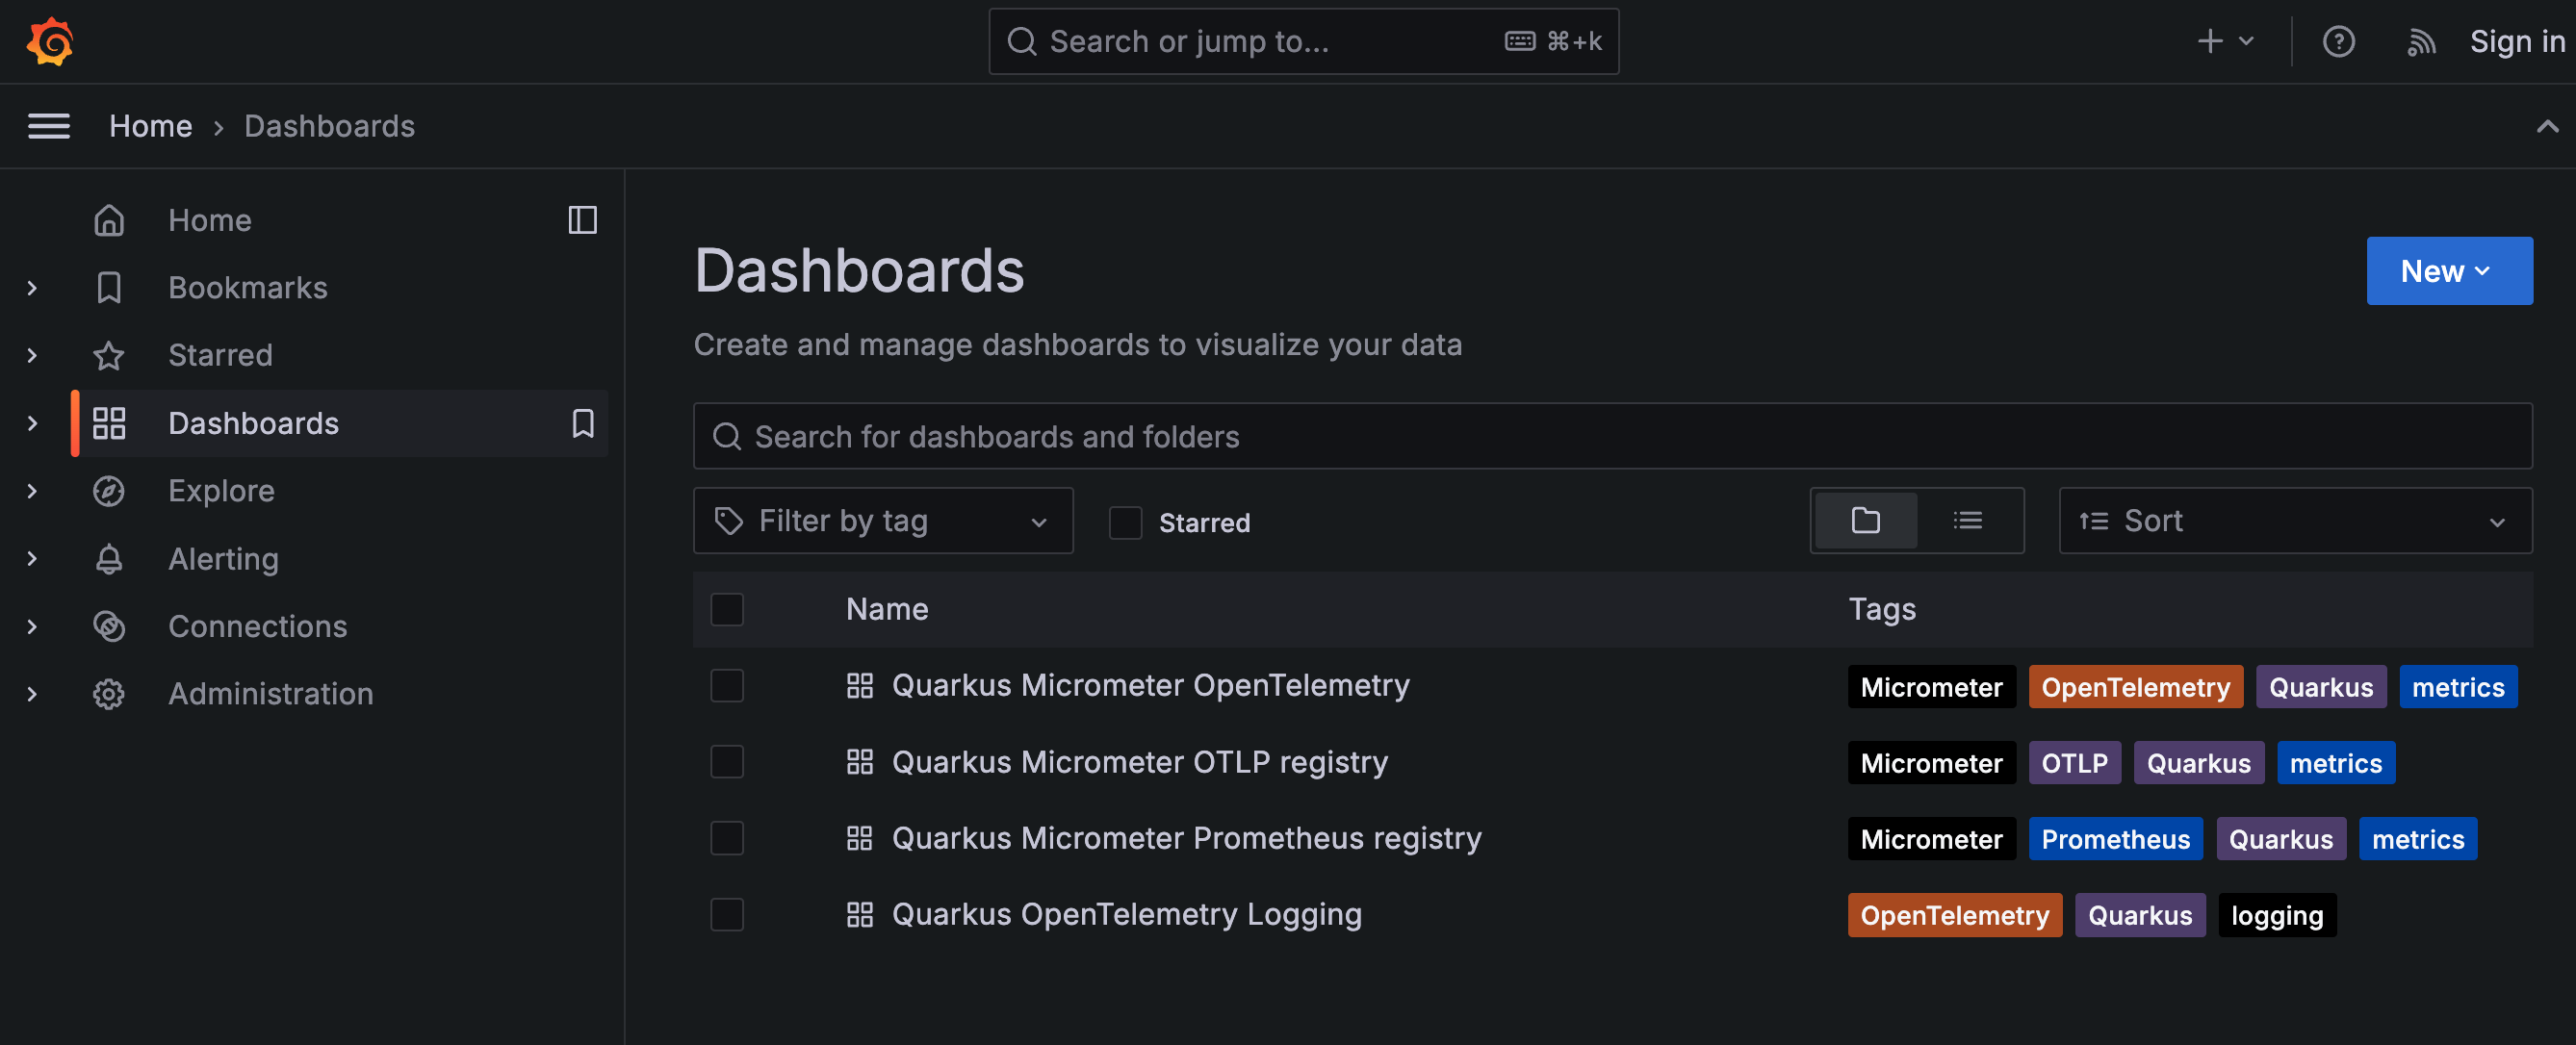
Each dashboard is tuned for the specific application setup. The available dashboards are:
-
Quarkus Micrometer OpenTelemetry: to be used with the Micrometer and OpenTelemetry extension.
-
Quarkus Micrometer OTLP registry: to be used with the Micrometer OTLP registry extension.
-
Quarkus Micrometer Prometheus registry: to be used with the Micrometer Prometheus registry extension.
-
Quarkus OpenTelemetry Logging: to view logs coming from the OpenTelemetry extension.
|
Some panels in the dashboards might take a few minutes to show accurate data when their values are calculated over a sliding time window. |
Custom dashboards
Users can add their own Grafana dashboards with their own configuration.
Place a grafana-dashboard-[your name].json file into the META-INF/grafana directory in your application, and LGTM Dev Services will pick it up automatically, and include this dashboard configuration in the overall Grafana dashboards YAML configuration.
For instance, the /META-INF/grafana/grafana-dashboard-my-simple-prometheus-dashboard.json configuration file creates a dashboard named My Simple Prometheus Dashboard.
Additional configuration
This extension will configure your quarkus-opentelemetry and quarkus-micrometer-registry-otlp extensions to send data to the OTel Collector bundled with the Grafana OTel LGTM image.
If you don’t want all the hassle with Dev Services (e.g. lookup and re-use of existing running containers, etc) you can simply disable Dev Services and enable just Dev Resource usage:
quarkus.observability.enabled=false
quarkus.observability.dev-resources=true
By default Quarkus lets Testcontainers expose random ports for Grafana and OTel, but you can force the usage of user-side fixed ports via setting the ports yourself - but then be aware of port conflicts.
quarkus.observability.lgtm.grafana-port=3001
quarkus.observability.lgtm.otel-grpc-port=5317
quarkus.observability.lgtm.otel-http-port=5318|
Internal container ports stay the same; e.g. 3000 for Grafana, 4317 for OTel gRPC, 4318 for OTel HTTP, etc |
Disabling observability Dev Services
Observability Dev Services are enabled by default in dev mode. To disable them entirely (both in dev and test mode), preventing the Grafana LGTM container from starting automatically, set:
quarkus.observability.enabled=falseThis also disables the Dev UI card, the shared container discovery, compose support and the OpenTelemetry override properties.
Automatic detection of explicit OTLP endpoint configuration
LGTM Dev Services will not start if an OTLP exporter endpoint is already explicitly configured. This prevents the Dev Service from overriding a custom collector (e.g. a Jaeger or Zipkin instance) that has been intentionally set by the user.
The following properties are checked, depending on which extensions are present:
| Extension | Property checked |
|---|---|
|
|
|
|
|
|
|
|
|
|
If any of those properties is explicitly set, the following log entry will appear and LGTM will not start:
Not starting LGTM Dev Services: 'quarkus.otel.exporter.otlp.traces.endpoint' is explicitly configured.If you need a custom endpoint in production but still want LGTM to start in dev mode, scope the property to the production profile so that it is invisible to the dev mode config:
%prod.quarkus.otel.exporter.otlp.traces.endpoint=http://my-collector:4318Enabling observability Dev Services in tests
By default, observability Dev Services do not start in test mode. To enable the Grafana LGTM container during tests, set:
quarkus.observability.enabled-in-tests=trueThis property has no effect in dev mode, where Dev Services are controlled solely by quarkus.observability.enabled.
For the least 'auto-magical' usage in the tests, you can explicitly list LGTM Dev Resource in the test as a @QuarkusTestResource resource:
@QuarkusTest
@QuarkusTestResource(value = LgtmResource.class, restrictToAnnotatedClass = true)
@TestProfile(QuarkusTestResourceTestProfile.class)
public class LgtmLifecycleTest extends LgtmTestBase {
}
Dev Resources mode
As an alternative to full Dev Services, you can enable a simplified Dev Resources mode. In this mode, containers are started lazily at runtime via a MicroProfile ConfigSource instead of during the build phase. This means there is no shared container discovery, no compose support, no Dev UI card and no OpenTelemetry override properties injected.
quarkus.observability.enabled=false
quarkus.observability.dev-resources=true|
|
MCP integration for AI tools
The LGTM Dev Service supports the Model Context Protocol (MCP), allowing AI coding tools like Claude Code and Cursor to query telemetry data directly from the running container.
Two MCP pathways are available:
| Component | MCP Server | Transport | Capabilities |
|---|---|---|---|
Grafana |
|
stdio |
Dashboards, PromQL, LogQL |
Tempo |
Built-in HTTP endpoint |
HTTP |
Traces via TraceQL |
Tempo MCP
The Tempo MCP server is automatically enabled and exposes an HTTP endpoint at port 3200 (/api/mcp).
You can fix the Tempo MCP port if needed:
quarkus.observability.lgtm.tempo-mcp-port=3200The mapped endpoint is available as the tempo-mcp.endpoint config property:
@ConfigProperty(name = "tempo-mcp.endpoint")
String tempoMcpEndpoint; // e.g. http://localhost:45678
To add the Tempo MCP server to Claude Code, use the endpoint from the Dev Service startup log:
claude mcp add --transport http tempo <tempo-mcp.endpoint>/api/mcpGrafana MCP
The Grafana MCP server runs as a client-side process on the host using uvx mcp-grafana and connects to the Grafana instance inside the container. It provides access to dashboards, PromQL queries (metrics), and LogQL queries (logs).
The mapped Grafana endpoint is available as the grafana.endpoint config property:
@ConfigProperty(name = "grafana.endpoint")
String grafanaEndpoint; // e.g. http://localhost:42797
After the container starts, a Grafana service account token is automatically created inside the container at /tmp/grafana-sa-token. You can retrieve it and the full MCP configuration:
# Find the container name
docker ps --filter "label=quarkus-dev-service=lgtm" --format '{{.Names}}'

# Retrieve the service account token
TOKEN=$(docker exec <container-name> cat /tmp/grafana-sa-token)

# Retrieve the full MCP configuration JSON
docker exec <container-name> cat /etc/lgtm/mcp.json
To add the Grafana MCP server to Claude Code (requires uvx), use the grafana.endpoint URL from the Dev Service startup log:
claude mcp add grafana \
  -e GRAFANA_URL=<grafana.endpoint> \
  -e GRAFANA_SERVICE_ACCOUNT_TOKEN="$TOKEN" \
-- uvx mcp-grafana|
The Grafana MCP server also proxies the Tempo MCP server, so adding both is optional. Tempo’s standalone endpoint is useful when you only need trace queries without the full Grafana integration. |
Exposed backend endpoints
In addition to the Grafana, Tempo MCP, and OTel Collector endpoints, the Dev Service also exposes the Prometheus HTTP API directly. This is useful for querying metrics programmatically without going through Grafana:
@ConfigProperty(name = "prometheus.endpoint")
String prometheusEndpoint; // e.g. http://localhost:39090
The full list of exposed endpoints:
| Config property | Descripción |
|---|---|
|
Grafana UI and API |
|
Prometheus HTTP API (e.g. |
|
Tempo query-frontend (search API and MCP) |
|
OpenTelemetry Collector (gRPC or HTTP, depending on |
Container component logging
You can enable container log output for individual LGTM components by setting the logging property. This maps to the ENABLE_LOGS_* environment variables in the container.
quarkus.observability.lgtm.logging=TEMPO,OTELCOLAvailable components: GRAFANA, LOKI, PROMETHEUS, TEMPO, PYROSCOPE, OTELCOL, OBI, ALL.
Shutdown timeout
The container forwards SIGTERM and SIGINT to every backend and waits for a graceful shutdown. By default the timeout is 5 seconds. You can override it:
quarkus.observability.lgtm.shutdown-timeout=15OBI (eBPF auto-instrumentation)
OBI (OpenTelemetry eBPF Instrumentation) automatically generates traces and RED metrics for HTTP/gRPC services without code changes. It requires Linux kernel 5.8+ with BTF support.
When enabled, the container is started with --pid=host and --privileged flags.
quarkus.observability.lgtm.enable-obi=true
quarkus.observability.lgtm.obi-target=java
Additional OBI targeting options:
| Property | Descripción |
|---|---|
|
Language ( |
|
Override which ports OBI monitors (e.g. |
|
Executable name pattern for targeting |
Customize backend configuration
Extra CLI arguments
Each backend supports extra CLI arguments appended at startup. The value is split on whitespace into separate arguments.
quarkus.observability.lgtm.prometheus-extra-args=--storage.tsdb.retention.time=90d
quarkus.observability.lgtm.loki-extra-args=-store.retention=90d
quarkus.observability.lgtm.tempo-extra-args=--additional-flag=value
quarkus.observability.lgtm.pyroscope-extra-args=--some-flag
quarkus.observability.lgtm.otelcol-extra-args=--some-flag|
Tempo always includes |
Custom configuration files
For deeper customization, you can mount full configuration files from the classpath into the container. Place your custom YAML file in src/main/resources/ and reference it:
quarkus.observability.lgtm.prometheus-config=my-prometheus.yaml
quarkus.observability.lgtm.loki-config=my-loki-config.yaml
quarkus.observability.lgtm.tempo-config=my-tempo-config.yaml
quarkus.observability.lgtm.pyroscope-config=my-pyroscope-config.yaml
quarkus.observability.lgtm.otelcol-config=my-otelcol-config.yaml| Property | Container path |
|---|---|
|
|
|
|
|
|
|
|
|
|
|
When a custom |
Pre-install Grafana plugins
You can pre-install Grafana plugins by setting a comma-separated list:
quarkus.observability.lgtm.grafana-plugins-preinstall=grafana-clock-panel,grafana-simple-json-datasourceSee the Grafana documentation for details on available plugins.
Custom Grafana home dashboard
To set a custom dashboard as the Grafana home dashboard, point to a dashboard JSON file path inside the container. This is useful in combination with Custom dashboards which are copied to /otel-lgtm/:
quarkus.observability.lgtm.grafana-home-dashboard-path=/otel-lgtm/grafana-dashboard-my-home.jsonForward telemetry to external vendors
The built-in OpenTelemetry Collector can forward telemetry data to external backends via OTLP/HTTP, enabling easy comparison between the local LGTM stack and a vendor backend.
quarkus.observability.lgtm.vendor-otlp-endpoint=https://otlp-gateway.example.com
quarkus.observability.lgtm.vendor-otlp-headers=Authorization=Basic xxx
Per-signal endpoints take precedence over the global endpoint:
quarkus.observability.lgtm.vendor-otlp-logs-endpoint=https://logs.example.com
quarkus.observability.lgtm.vendor-otlp-metrics-endpoint=https://metrics.example.com
quarkus.observability.lgtm.vendor-otlp-traces-endpoint=https://traces.example.com
Testing full Grafana OTel LGTM stack - example
Use existing Quarkus MicroMeter OTLP registry
<dependency>
    <groupId>io.quarkiverse.micrometer.registry</groupId>
    <artifactId>quarkus-micrometer-registry-otlp</artifactId>
</dependency>implementation("io.quarkiverse.micrometer.registry:quarkus-micrometer-registry-otlp")Simply inject the Meter registry into your code — it will periodically push metrics to Grafana LGTM’s OTLP HTTP endpoint.
@Path("/api")
public class SimpleEndpoint {
    private static final Logger log = Logger.getLogger(SimpleEndpoint.class);

    @Inject
    MeterRegistry registry;

    @PostConstruct
    public void start() {
        Gauge.builder("xvalue", arr, a -> arr[0])
                .baseUnit("X")
                .description("Some random x")
                .tag("my_key", "x")
                .register(registry);
    }

    // ...
}
Where you can then check Prometheus for existing metrics data, using the exposed prometheus.endpoint:
public class LgtmTestBase {

    @ConfigProperty(name = "grafana.endpoint")
    String endpoint; // NOTE -- injected Grafana endpoint!

    @ConfigProperty(name = "prometheus.endpoint")
    String prometheusEndpoint; // NOTE -- injected Prometheus endpoint!

    @Test
    public void testTracing() {
        String response = RestAssured.get("/api/poke?f=100").body().asString();
        System.out.println(response);
        GrafanaClient client = new GrafanaClient(endpoint, prometheusEndpoint, null, "admin", "admin");
        Awaitility.await().atMost(61, TimeUnit.SECONDS).until(
                client::user,
                u -> "admin".equals(u.login));
        Awaitility.await().atMost(61, TimeUnit.SECONDS).until(
                () -> client.query("xvalue_X"),
                result -> !result.data.result.isEmpty());
    }

}
